Foresight™ — now in pilot with mid-size general contractors
Know which projects will slip — before they do
Foresight watches the PM actuals you already collect and flags jobs trending toward overrun, months before it shows up in the monthly review.
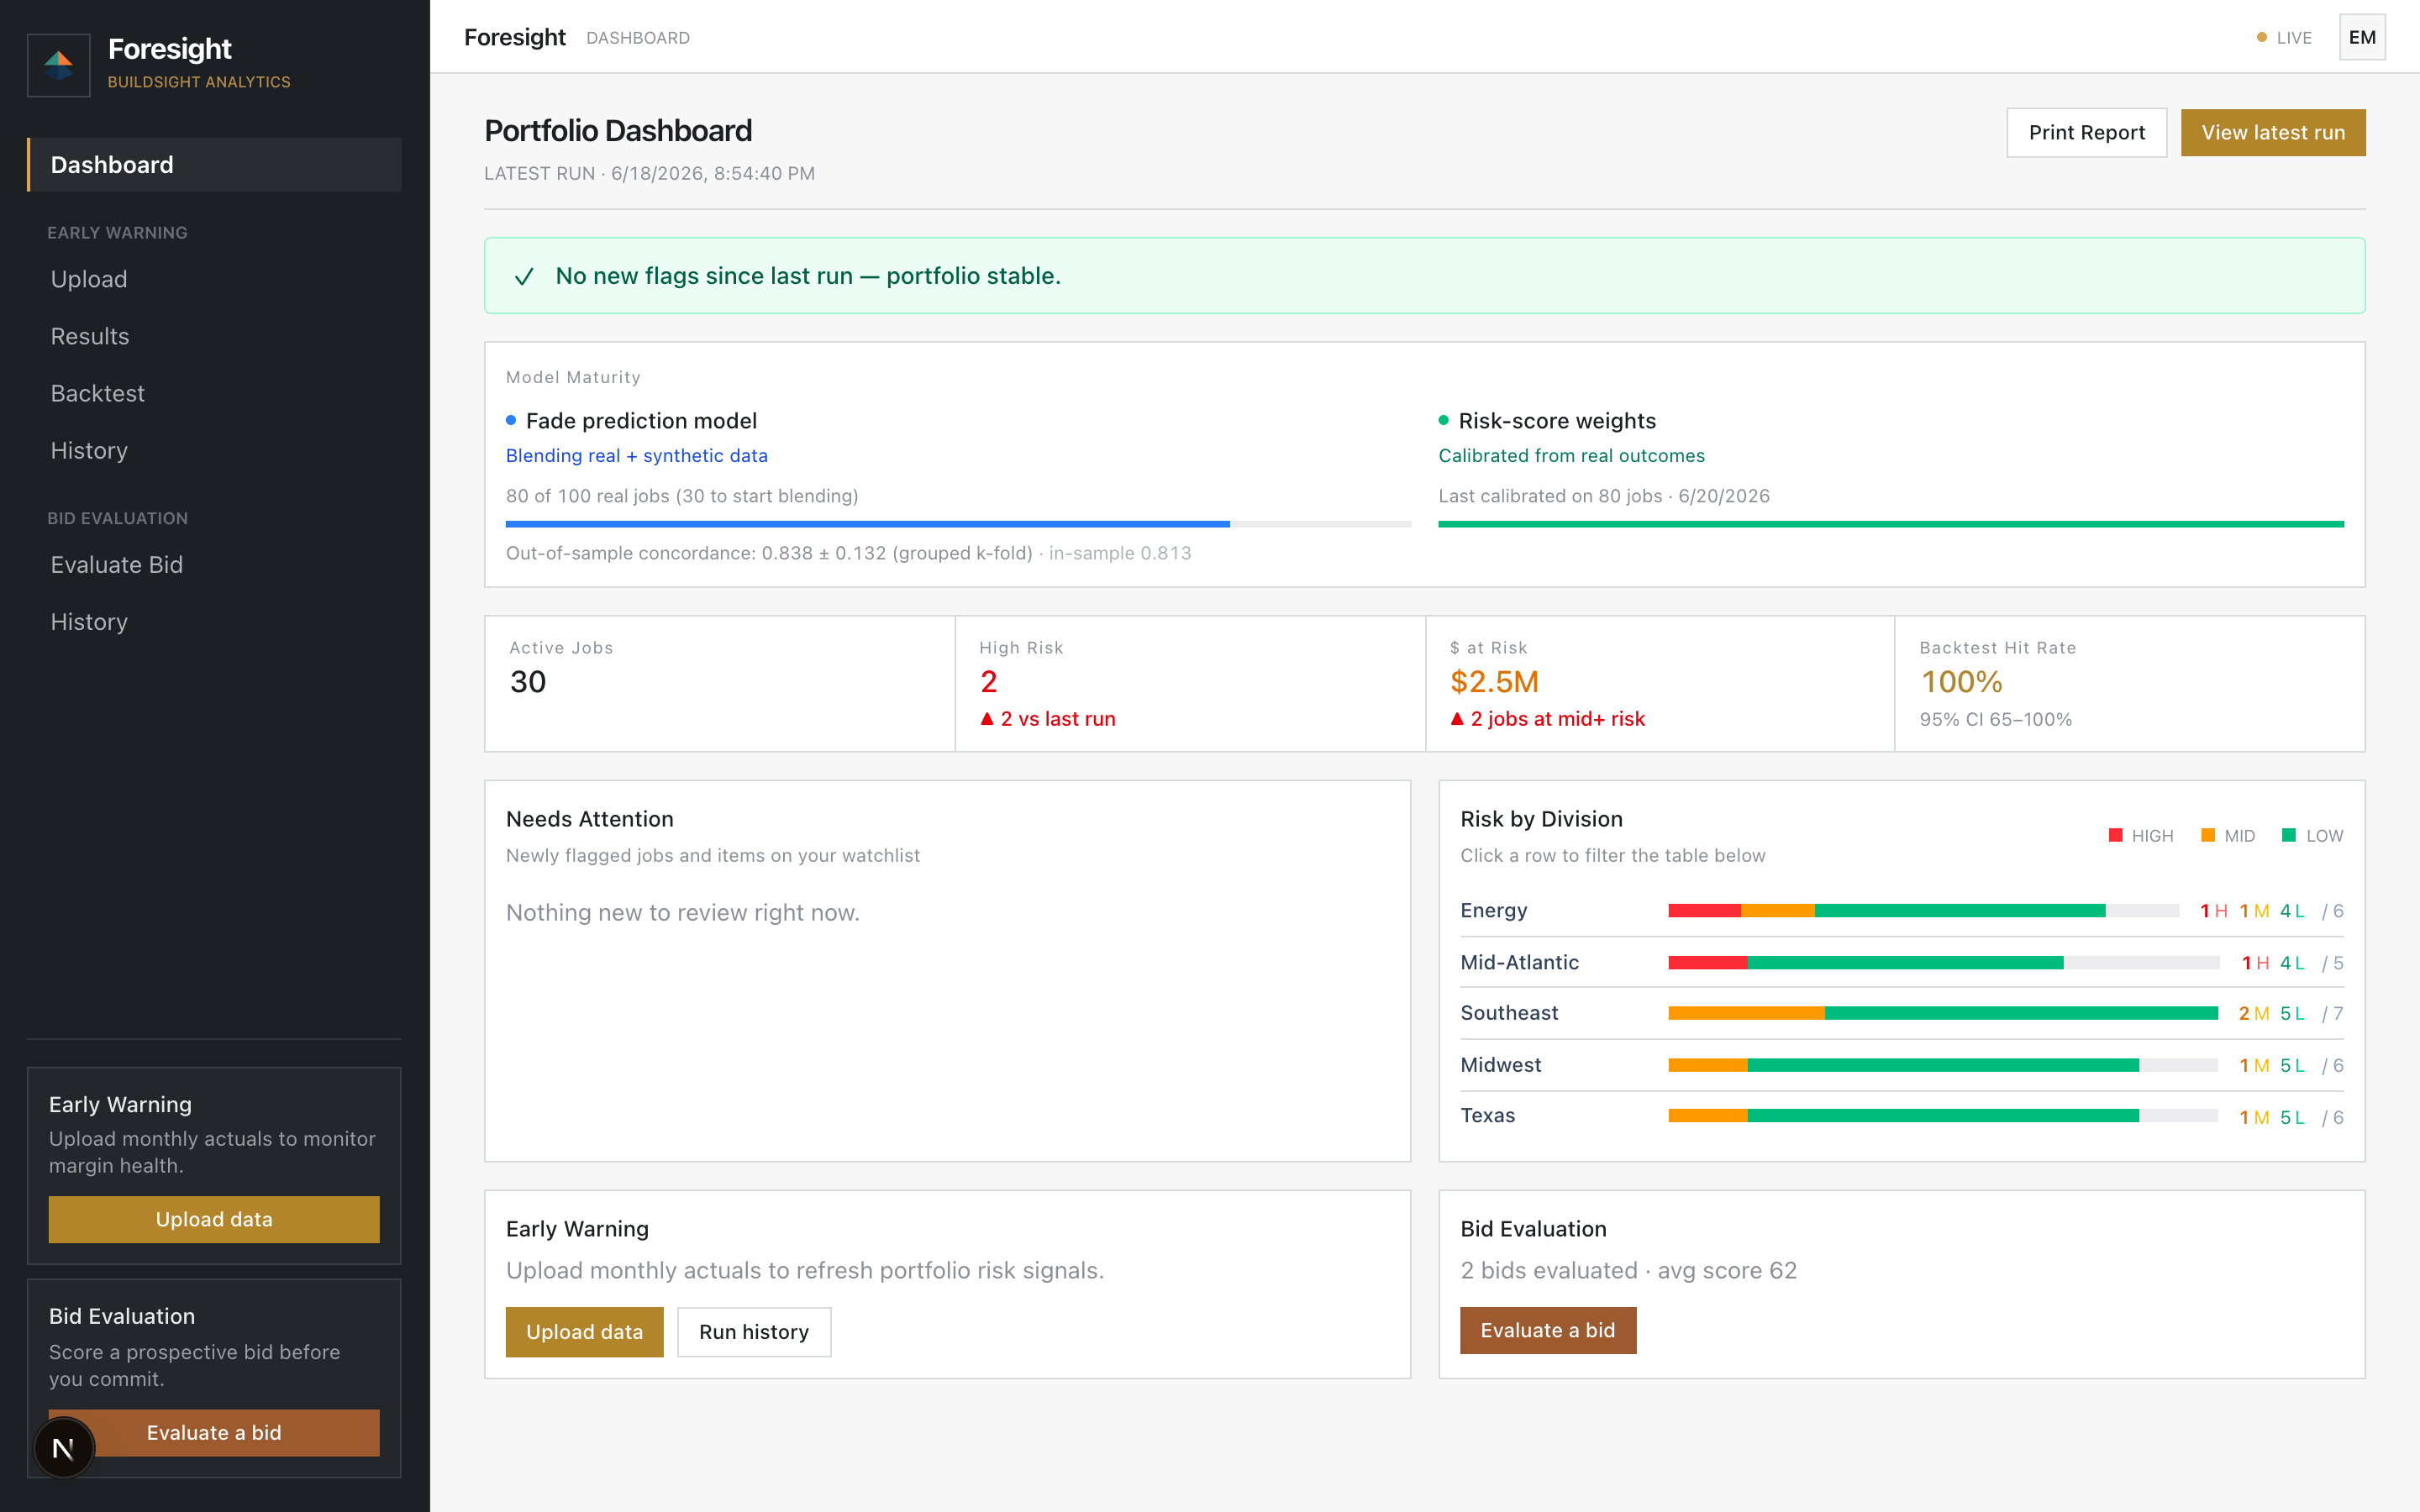
Foresight watches the PM actuals you already collect and flags jobs trending toward overrun, months before it shows up in the monthly review.
The problem
Monthly cost reviews tell you where a project was, not where it’s going. The early signals are already in your PMs’ actuals — buried across spreadsheets where no one can see the trend forming.
Fade shows up in the forecast only after the margin is already gone, when recovery options have narrowed to bad and worse.
Cost-to-date and percent-complete say little about trajectory. Two jobs at 40% complete can be headed to very different endings.
Execs see each job in isolation. Nobody sees which three of your twenty active jobs deserve attention this week.
How it works
No integrations, no IT project. Foresight runs on a monthly spreadsheet of job-level numbers you already track.
Put your monthly job actuals — contract value, revenue, cost — into Foresight’s Excel template. Foresight detects your columns and validates the data before anything is scored.
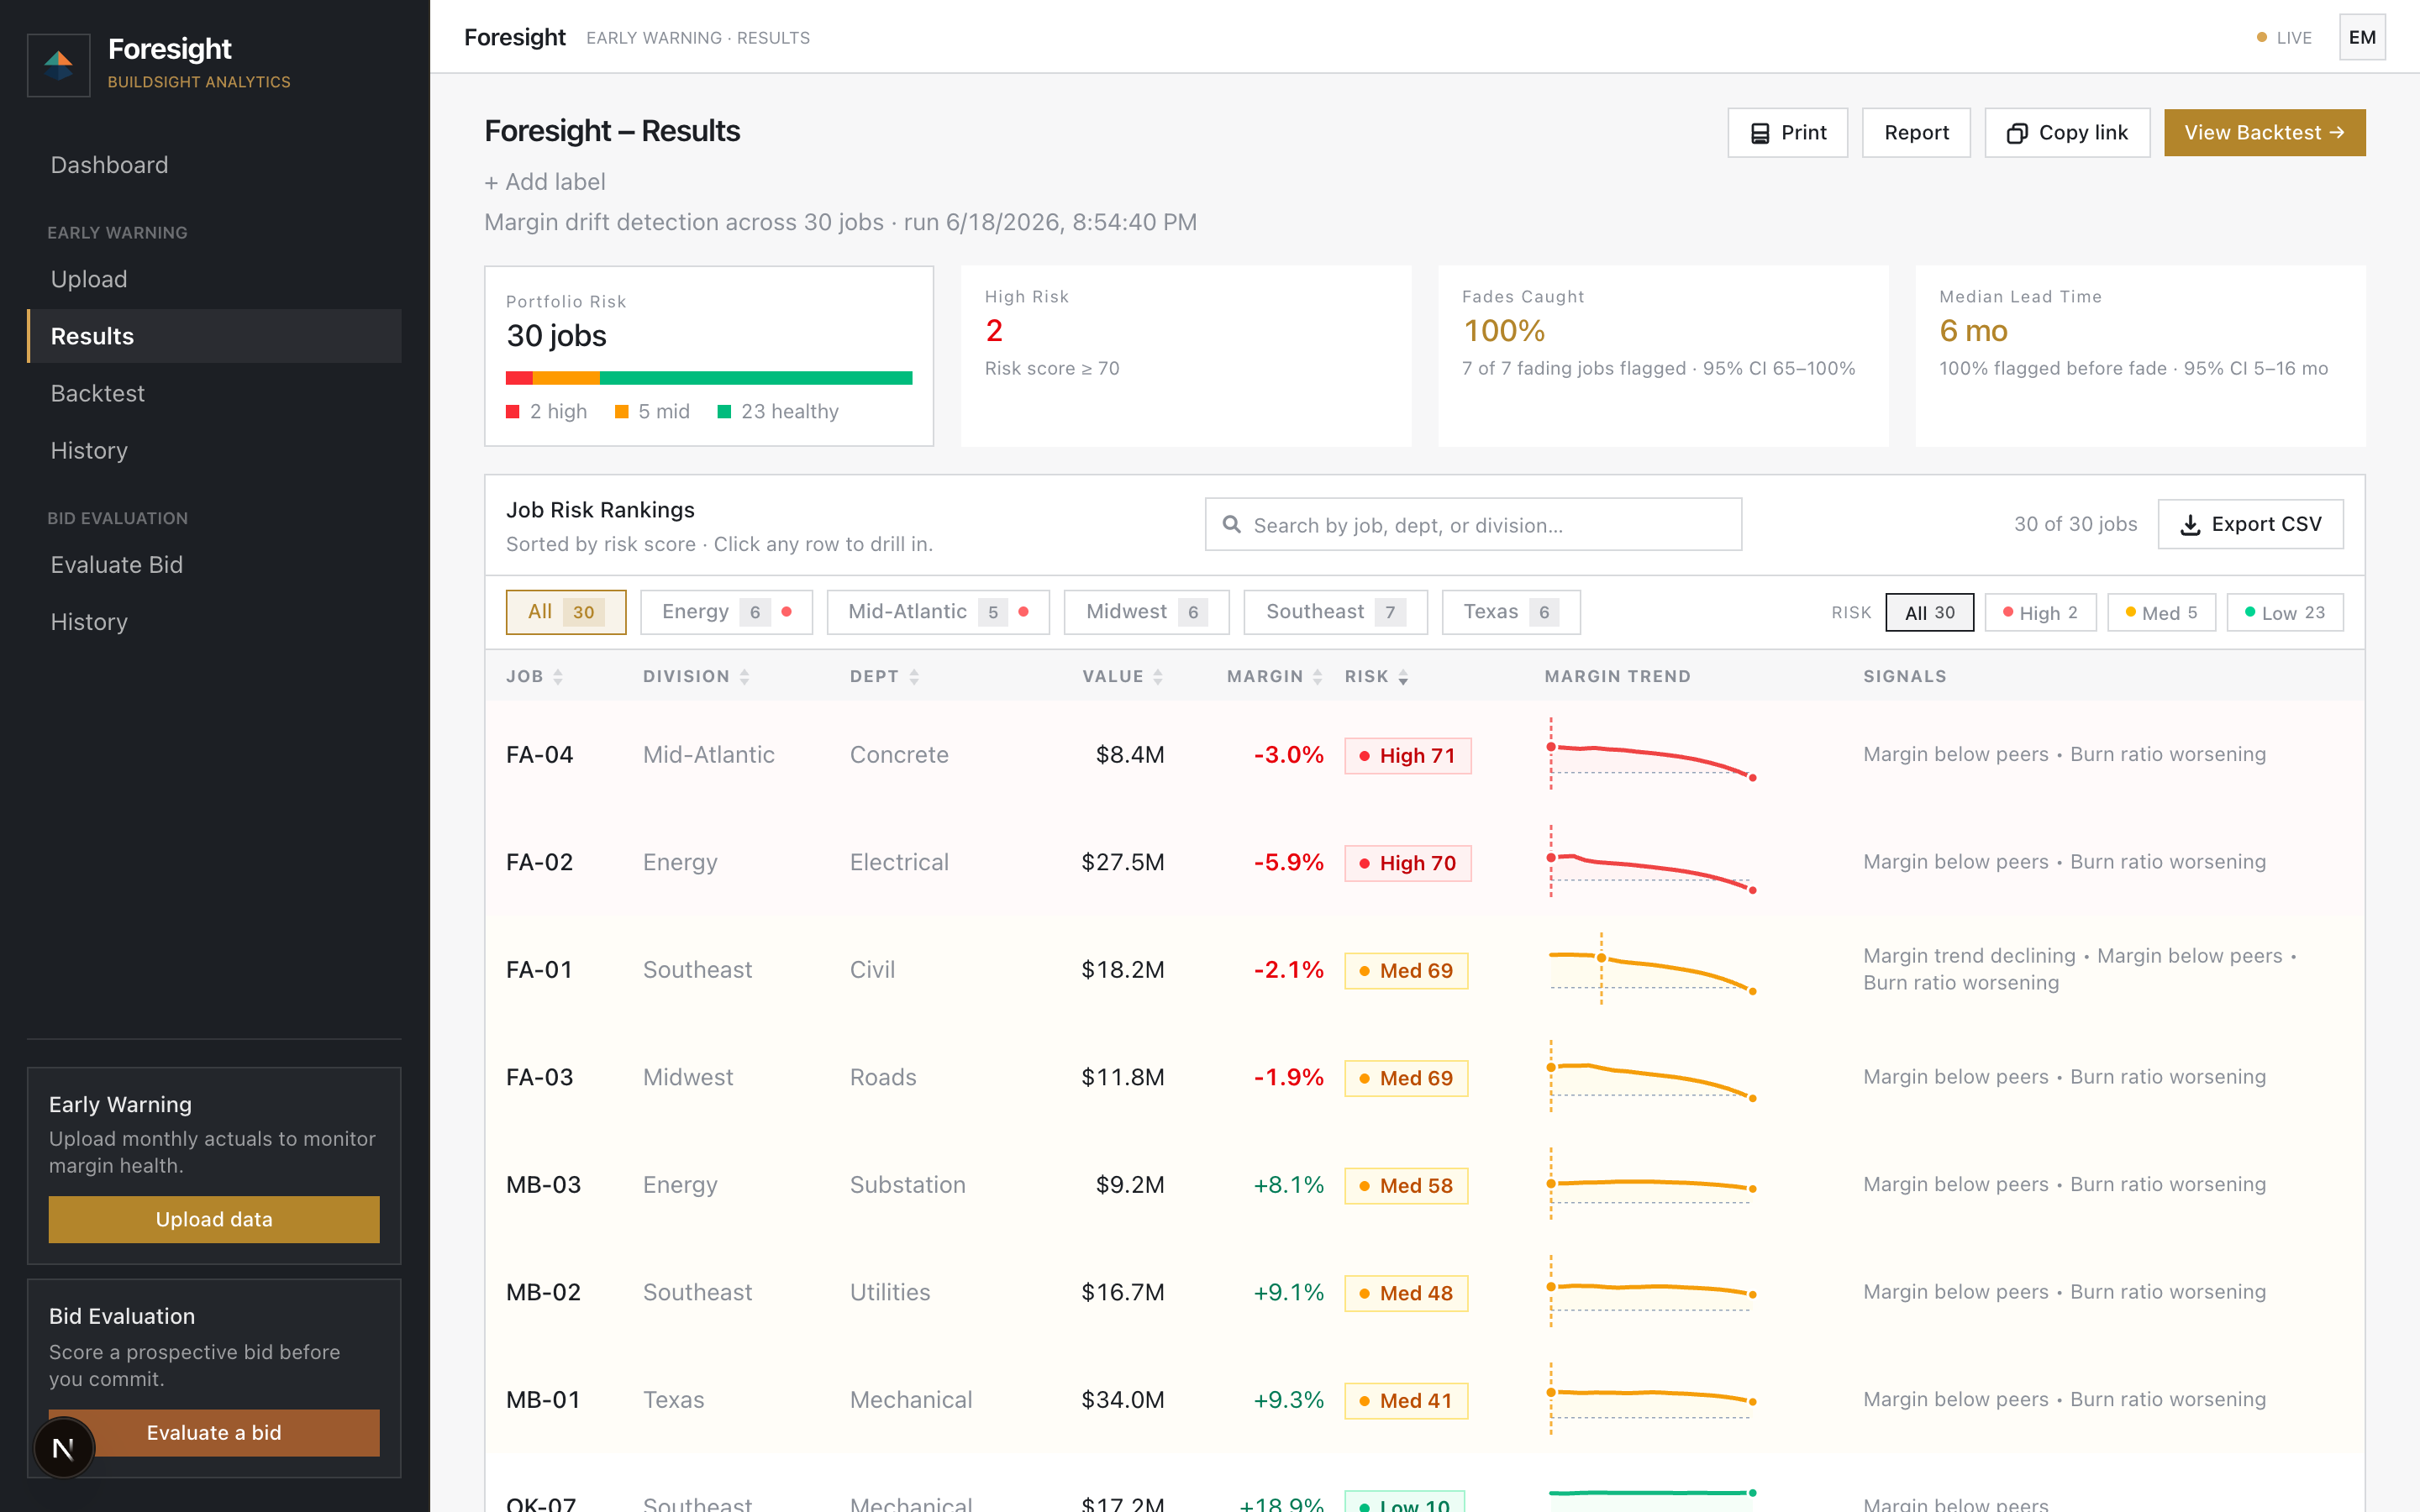
Each active job gets a risk score and a fade forecast — the odds its margin erodes in the next three to six months, and the dollars at risk if it does — built from how similar jobs in your history actually played out.
A portfolio dashboard ranks jobs at mid risk or higher, so Monday morning starts with the three jobs that need a conversation.
Product
Continuous monitoring of every active job, with flags raised the moment a project starts trending toward overrun.
The same models that watch your active jobs can read a prospective one — and tell you how jobs like it have gone for you before.
Why trust it
Before Foresight flags a single live job, it replays your completed projects and shows you exactly how often it would have caught the fades — and how early. You see the hit rate on your own data before you rely on it.
Get started
Pilots run on your historical data first, so you see the backtest hit rate before a single live job is scored. Setup takes one spreadsheet.